Inverted Call Stacks
Flamegraphs are a great way to visualize the performance of your application. They show you where your application is spending its time and can help you identify bottlenecks. However, in some cases, it can be beneficial to invert the call stacks in a Flame Graph. This can help you identify which functions are calling other functions and can give you a better understanding of the flow of your application.
Example use case
Say, you want to understand the memory allocation pattern of your application. In this case, you can invert the call stacks in a Flame Graph to easily identify which functions are allocating memory and which functions are calling those functions.
For example, consider the following flamegraph:
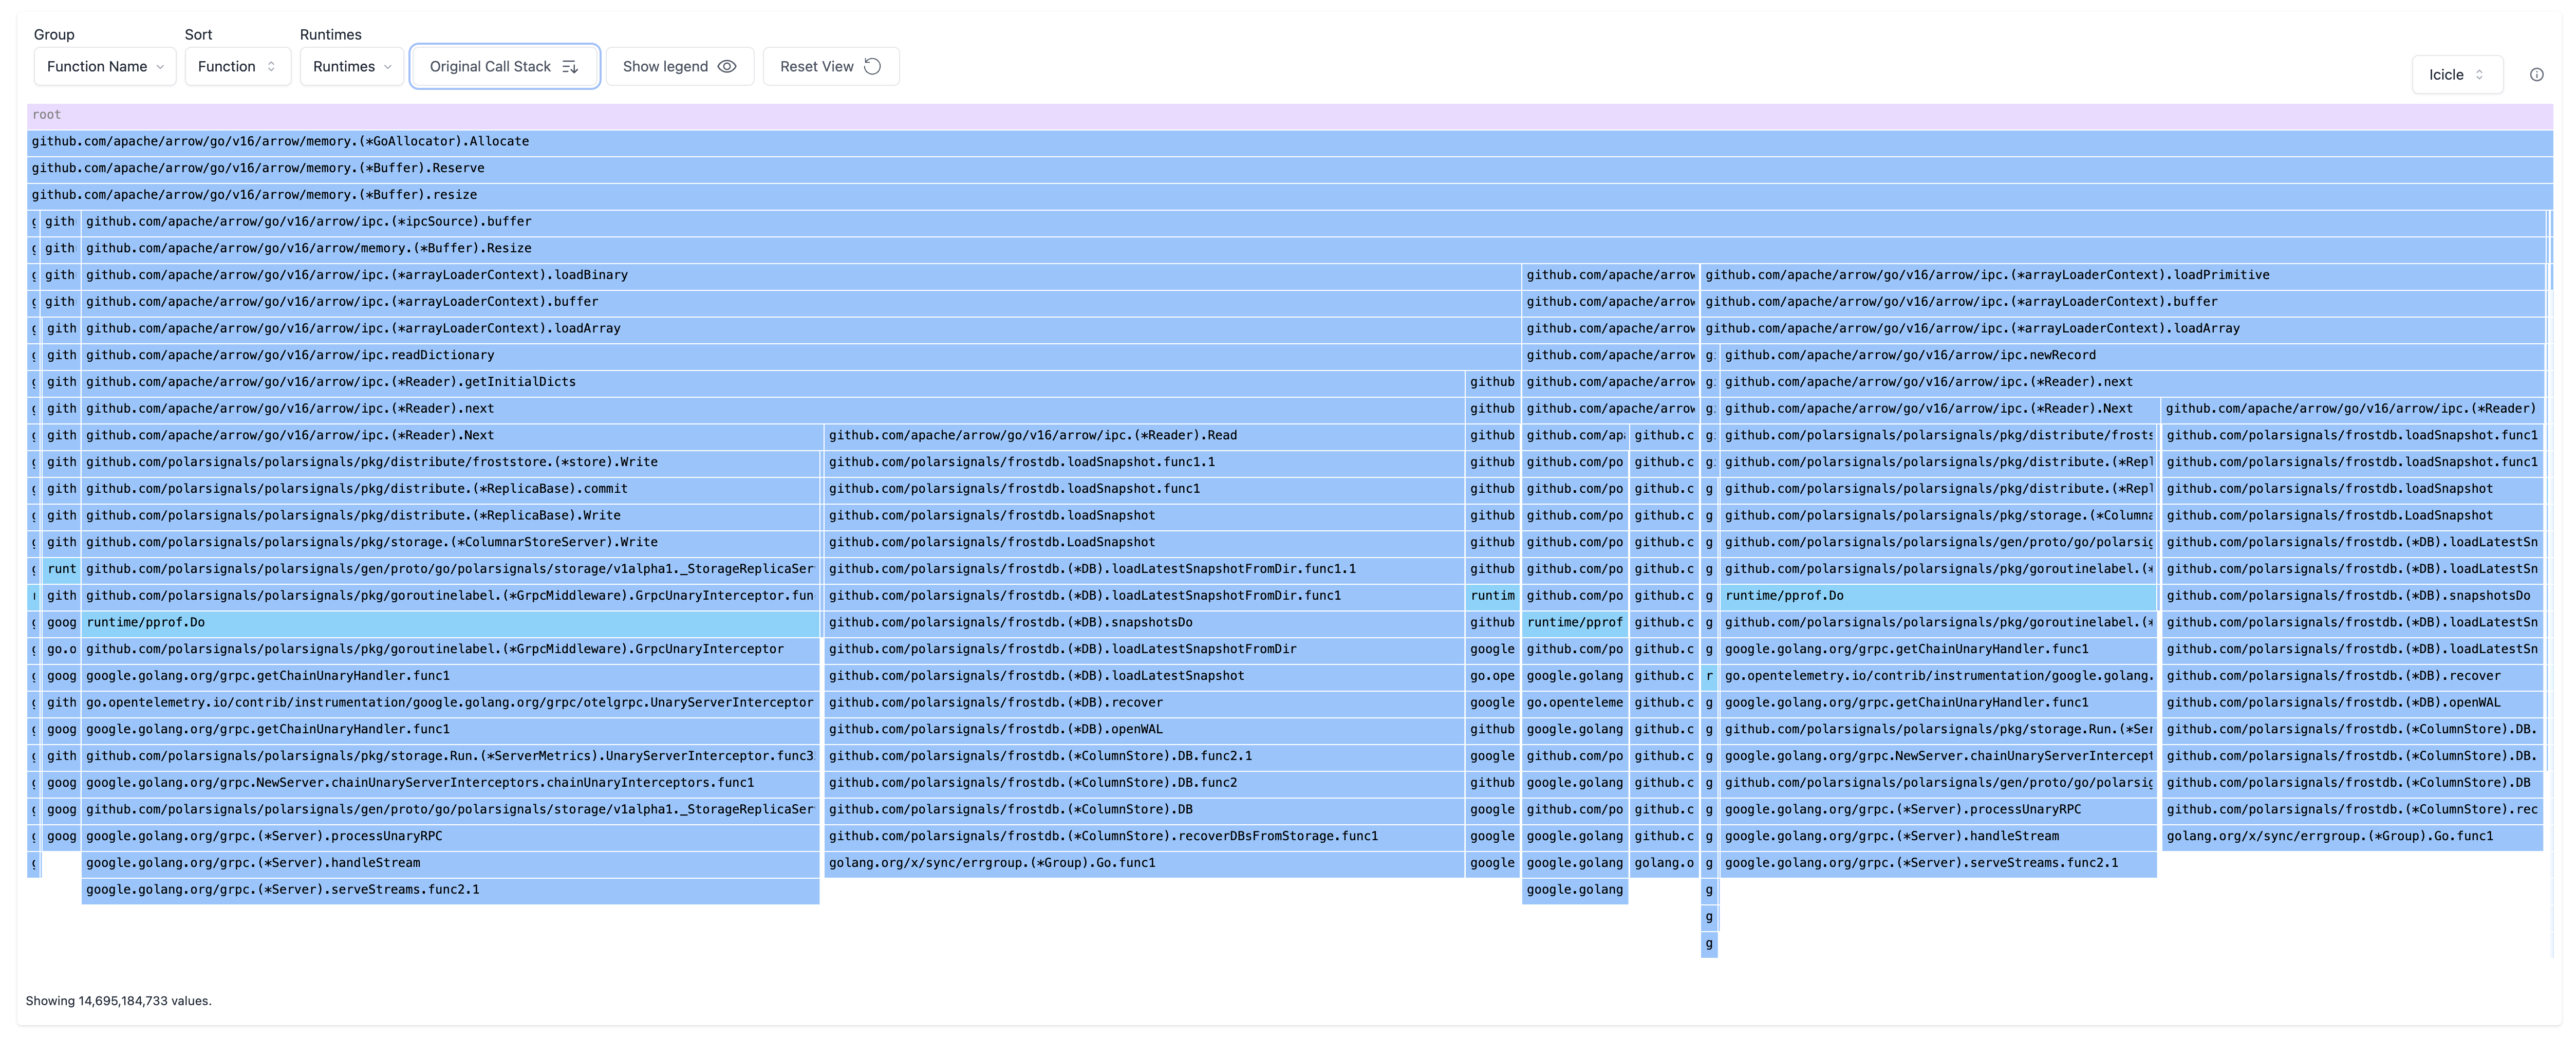
In this, you can a clear view of which functions are called the memory.Allocate function. This can help you identify which functions are allocating memory and can help you optimize your application.
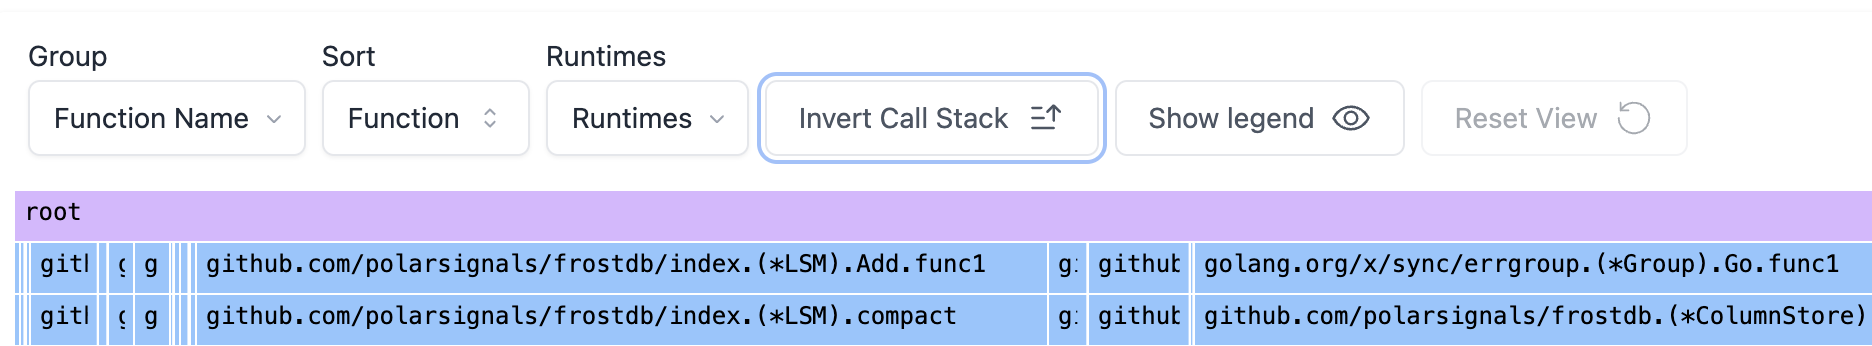
How to view inverted call stacks
To view the inverted call stacks in a Flame Graph, you can use the "Invert Call Stack" button in the flamegraph view and this will invert the call stacks and show you the Flame Graph.