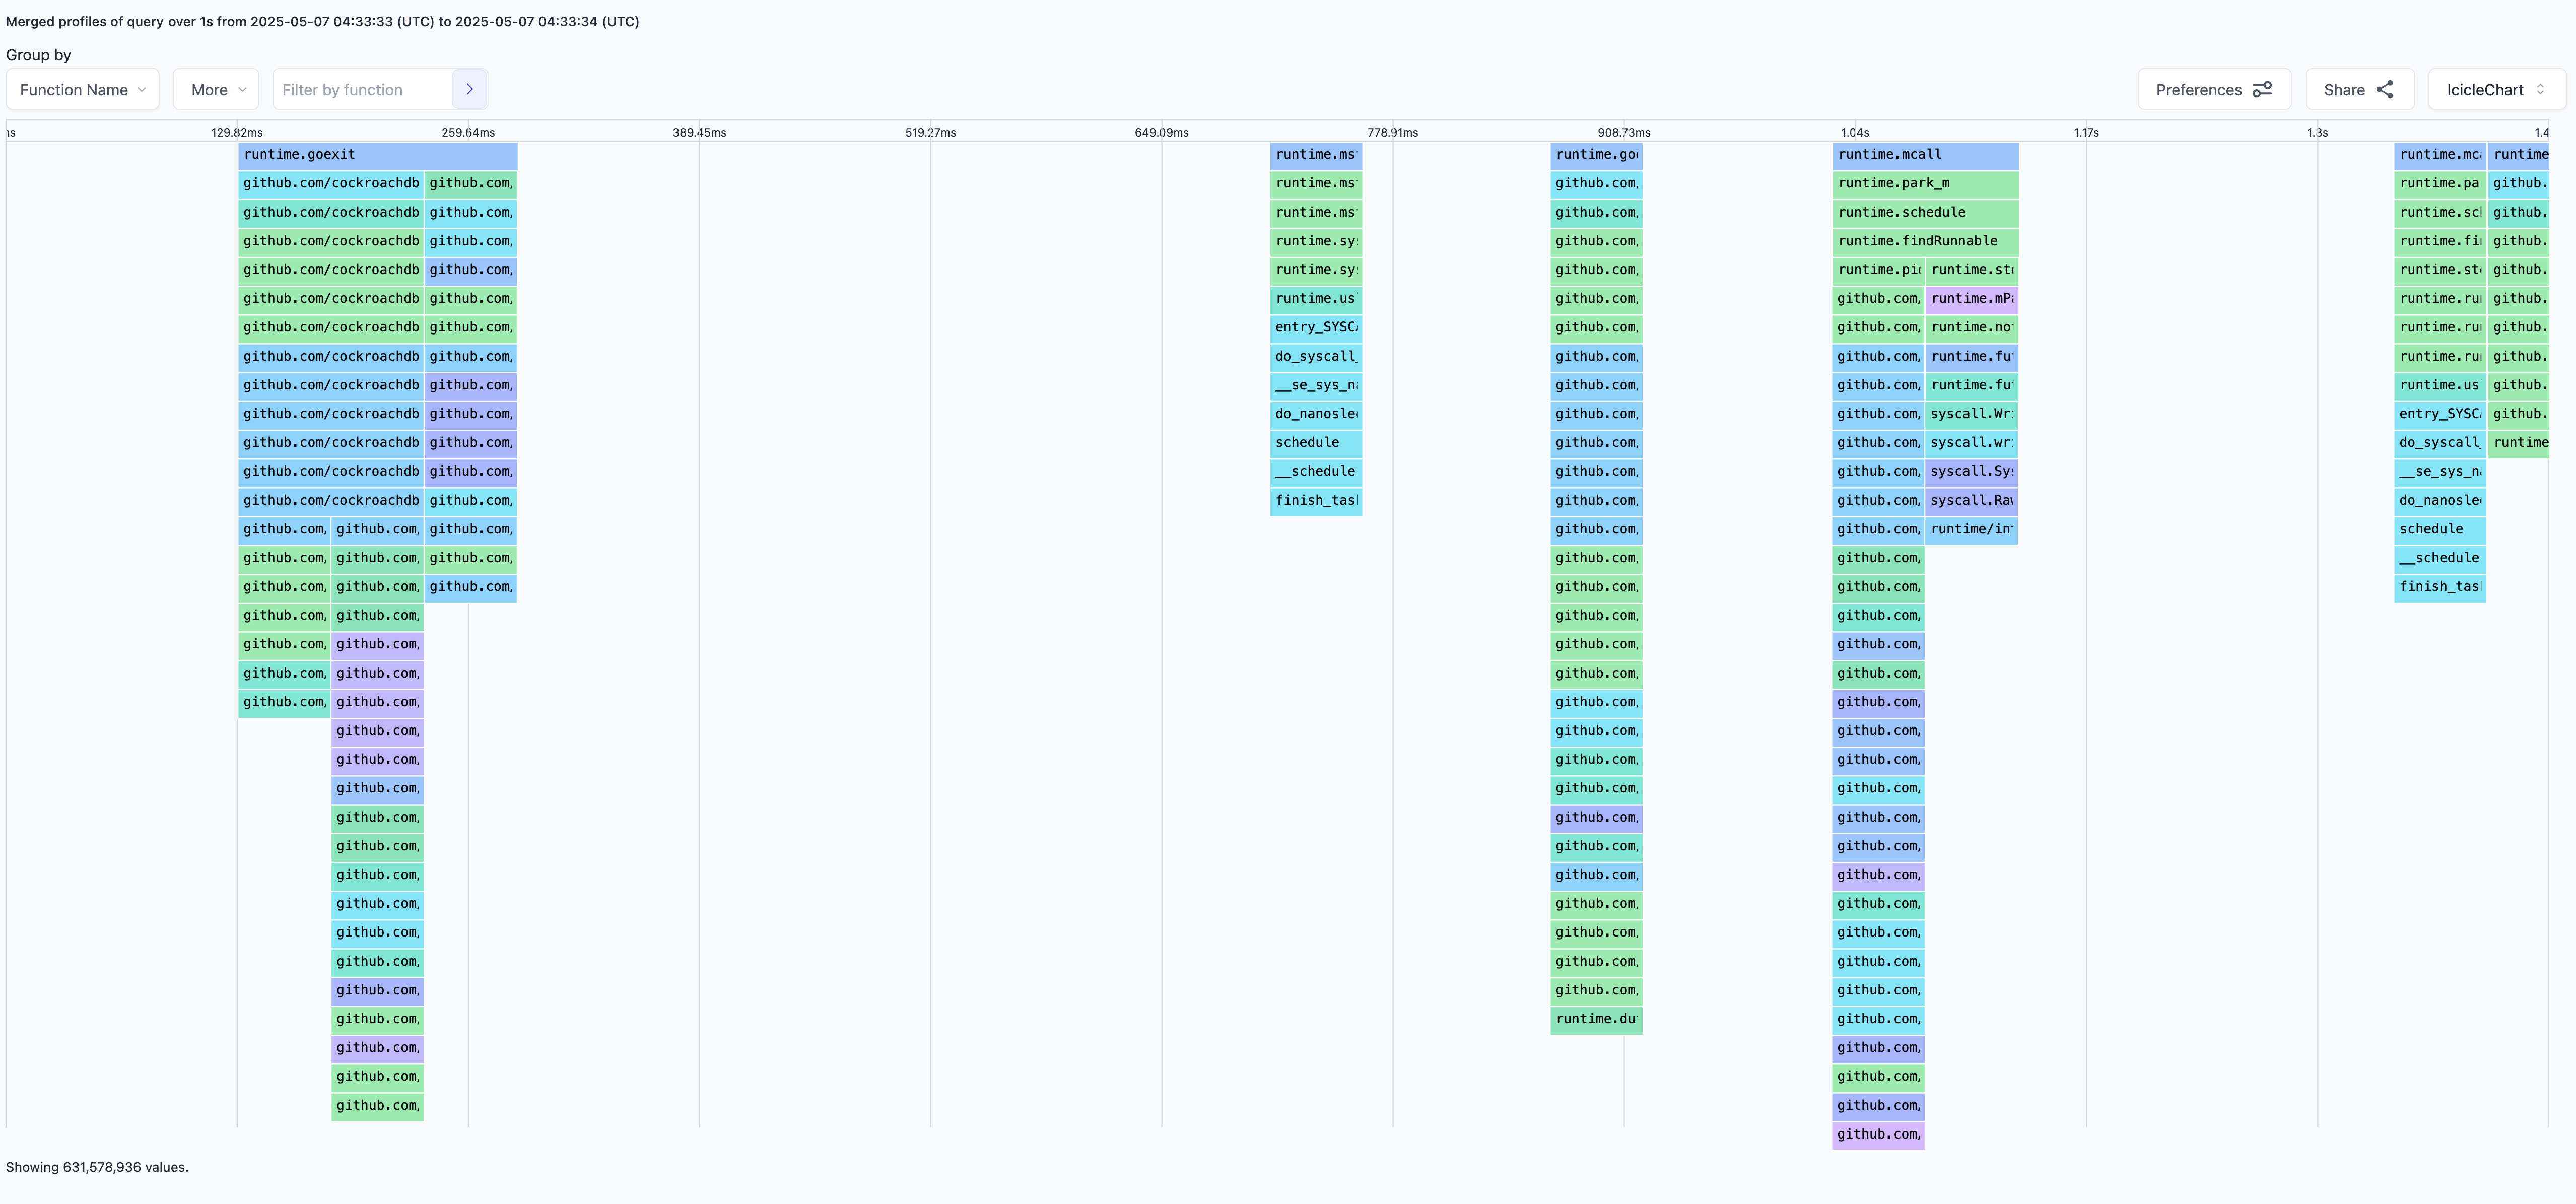
Flame Charts with CPU profiling data
The Flame Chart is a visualization method that allows you to see the CPU usage of your application over time. In other words, it is similar to a flame graph, but has an additonal time dimension. This means that you can see how the CPU usage of your application changes over time, and how it is affected by different events.
Screenshot of Flame Chart with CPU profiling data:
Prerequisite
The Parca Agent automatically attaches cpu and thread_id labels to all CPU profiling data. These labels ensure that samples never have overlapping timestamps, since threads and CPUs can't have two things running on them at the same time, making them well suited for Flame Chart visualization.
No additional configuration is needed. Just make sure you have not disabled these labels via --metadata-disable-cpu-label or --metadata-disable-thread-id-label. See the labels documentation for more details.
How to use Flame Chart with CPU profiling data
Once you're on the Polar Signals cloud, you can use Flame Chart by selecting the Flame Chart option in the visualization type dropdown.
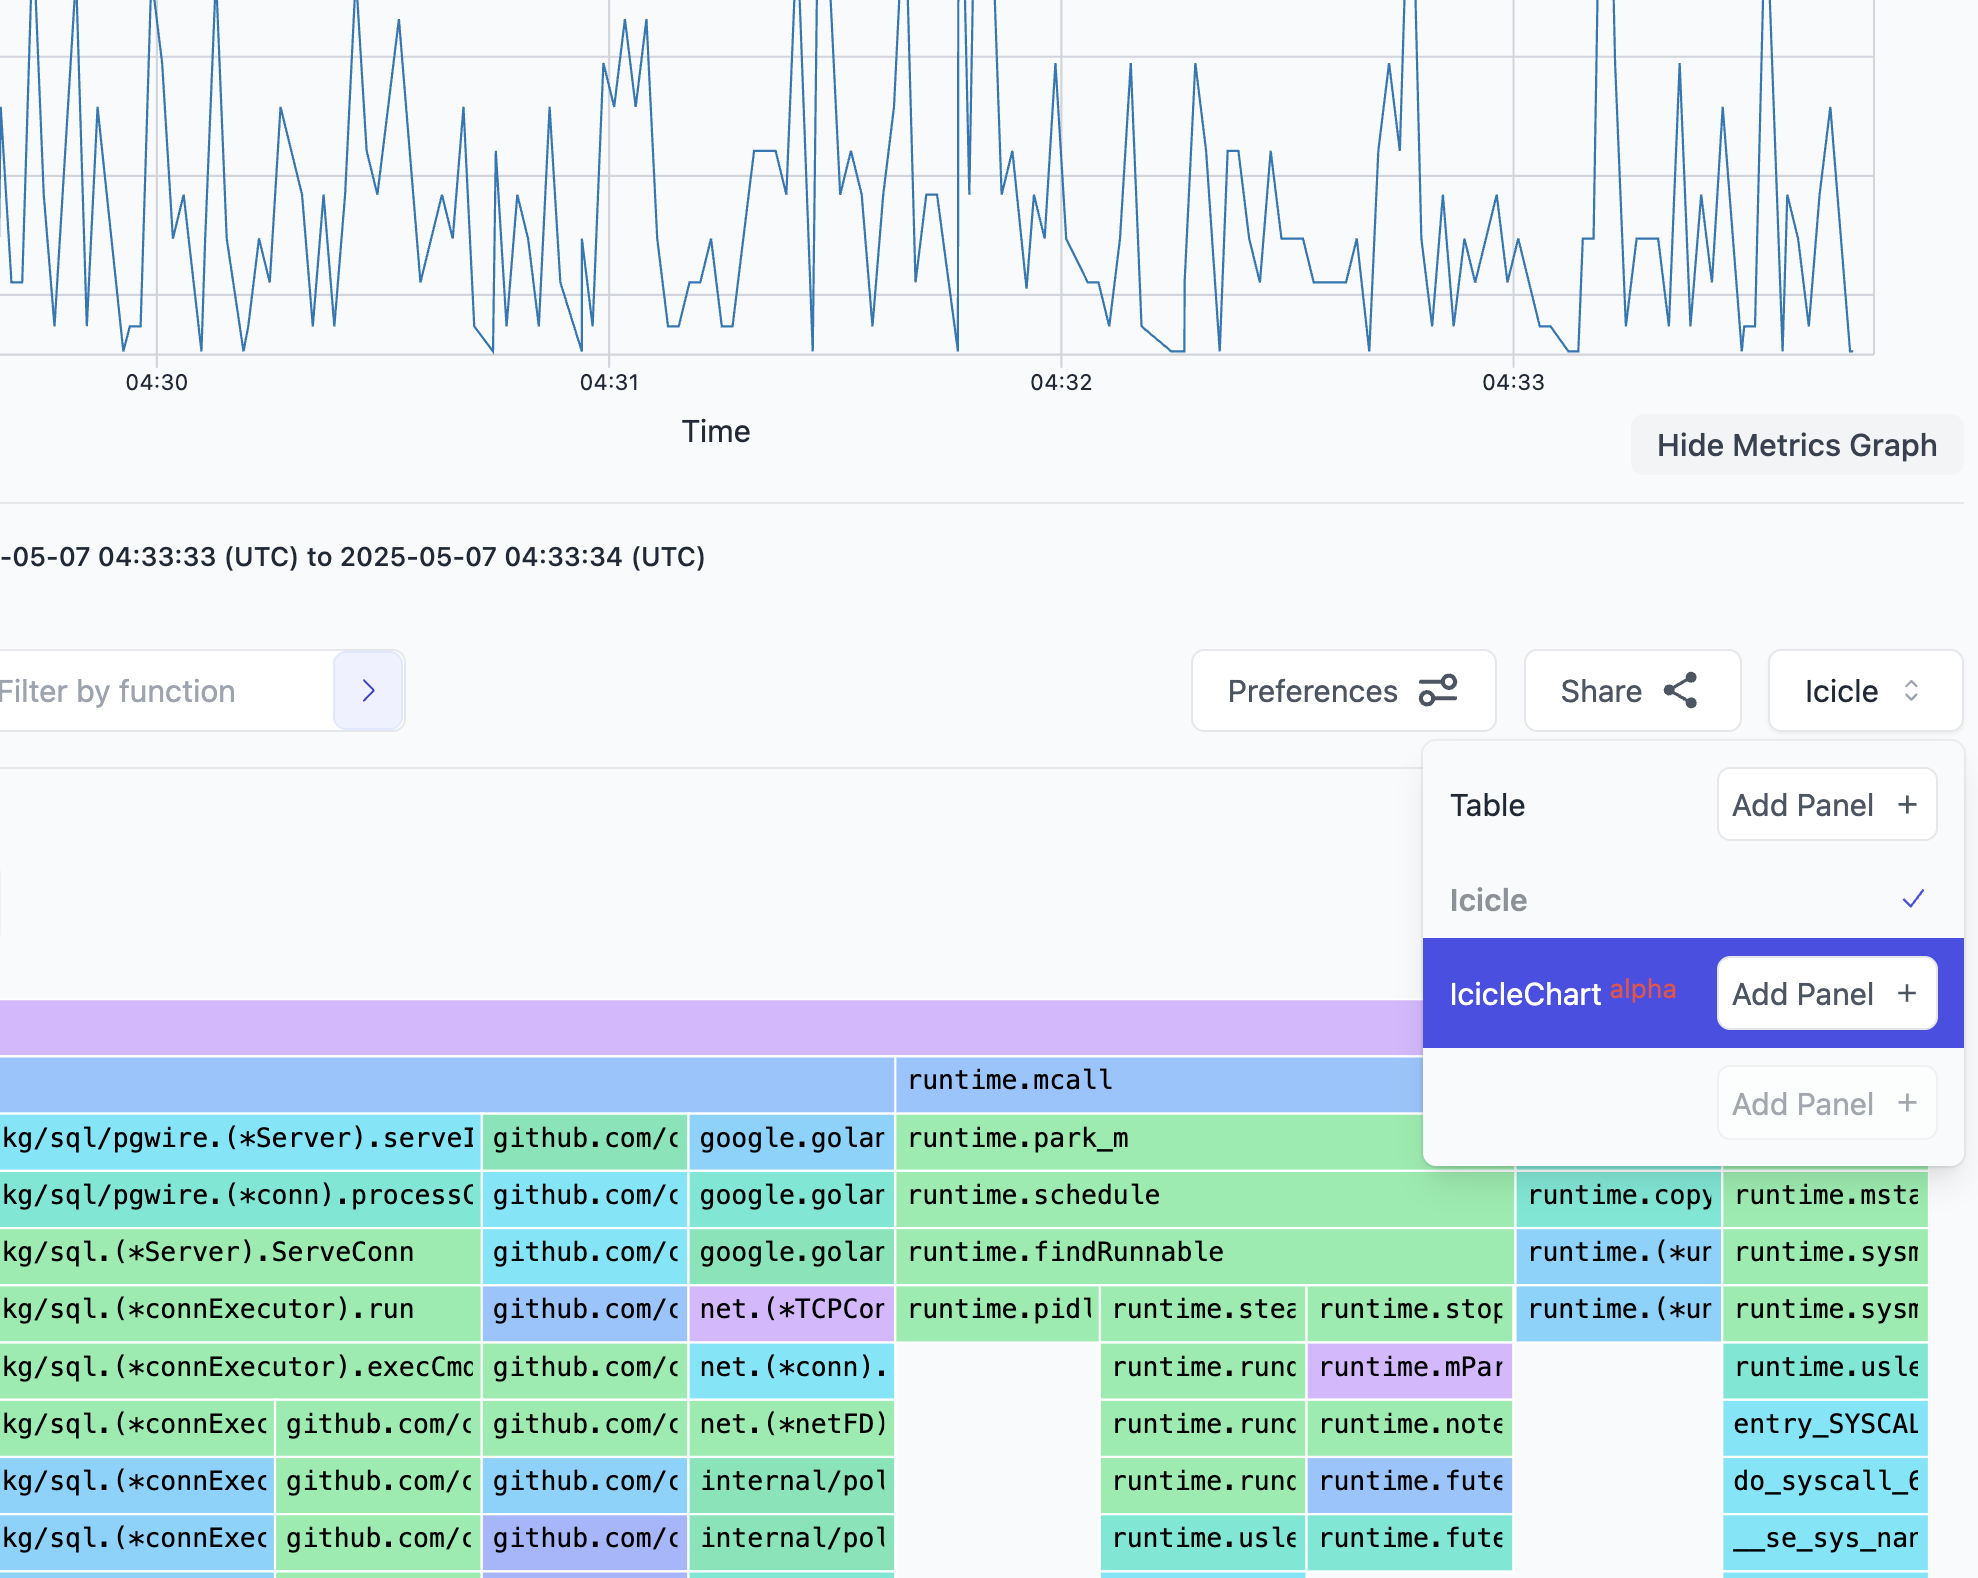
Note: Since the Flame Chart is right now in alpha, you will have to specifically enable Flame Charts in the Preferences section. you can do this by clicking on the Preferences button near the visualization type selector and then toggling the Enable Flame Charts on.
Recommended Usage
It is always recommended to use flame chart with the following query conditions:
- Add a
nodefilter to the query to limit the data to a specific node. - Add either
cpuorthread_idlabel to theSum bysection to group the data by CPU or thread ID.